Showing posts with label Oakley Creek. Show all posts

Saturday, 5 November 2011

final exhibition


This exhibition is the conclusion of my mapping project concerning Oakley Creek. 

I feel as though I met a lot of personal goals I had for this project. The data collection was very thorough, and I enjoyed visiting the creek three times to understand differences that occur, even in short periods of time. Telling the story of Oakley Creek through sections, identifying permanent features and objects found, was successful in revealing activities and a sense of place. Each place along Oakley Creek different and dynamic. I felt that by doing a series of sections, hung and viewed in succession were effective for the exhibition and the telling of Oakley Creek.  The cadbury tinfoil track that revealed a person quit happily ate and deposited an entire Cadbury chocolate bar on his walk along the creek. The identification of plants that showed the exotic species more commonly planted on the right side of the river (where buildings have been developed and trees have been planted as mitigation). The clear plastic bottle that remained, caught in perpetual motion, at the same part of the creek for the entire 6 days. The tidy up of rubbish that occurred between my 2nd and 3rd visit at the waterfall (place 5). These events and curiosities were revealer through analysis of my data.

I was especially challenged by naming different species of plants and animals, as well as infrastructure. I sought advise from several people in identifying what I wasn't sure of. This identification was important to understand what was exotic and native, and to be able to communicate that. An infrastructure engineer and a landscape student (also in the Friends of Oakley Creek) were consulted. Being specific about rubbish was important too, instead of 'can' I wrote more detail where possible, e.g. 'coke can, 250ml.' It was this that made my data collection interesting to me and create curiosity for the viewers. I carefully considered how to represent the series of times the creek was visited, choosing to separate the objects found from permanent features, at different heights on the page. Research I had done that was appropriate to the places I chose were also applied to the drawings to show what the found objects didn't. My representation of Oakley Creek has implications for time, distance, and a dynamic not understandable when looking at traditional mapping. 

Upon reflection, there are several things I would have done differently, including allowing more length for the hanging of the drawings so they could be viewed in detail more easily. However the drawings were well interacted with during the exhibition opening, and people that I talked to understood what they were communicating a series of places along Oakley Creek, and the objects found there on different days.  It was very special to have Wendy from the Friends of Oakley Creek attend the exhibition and to feel a part of wider research and work on the creek. 

This fine grain analysis, in contrast to the top-down plan for the Waterview motorway Connection, represents the place of Oakley Creek through sections and the collection and representation of objects found across a series of days. I feel as though I have, through grounding in theory and related ideas, engaged in thorough research and data collection to address issues facing the art of mapping, issues of place, and issues confronting Oakley Creek itself. 


Wednesday, 5 October 2011

objectives

breaking it down:


my objectives are to
1. explore the section (a series of sections) as a way to represent place, particularly the place of Oakley Creek
2. explore the identification, representation and location of objects in a place as a means to communicate its story

Tuesday, 6 September 2011

thinking about presentation

I am yet to gather my data, so this is very much subject to change, but I have some initial ideas of how my project might be presented in the final exhibition. I'm recording found objects to represent a series of places, at this stage in section, so that a journey might be formed along Oakley Creek. This should be done in very careful, probably hand-drawn media so as to contrast the digital-site-is-all-the-same-master-plan-approach. I like the idea of the sections being at eye level, in separate clear boxes along the wall so that one can walk beside them and imagine the journey, in reference to this would be a master plan/bird's eye view map, possibly disconnected, to enforce a top-down view. See my drawings below.


reading ahead / links to wider theory of mapping

I have been questioning my project's relationship to the literature I had read so far. Although I can definately say my ideas had been inspired by previous literature, they didn't totally connect or resonate on a level I felt satisfied with. I'm very glad to have read ahead and found Abrams, J, Hall, P and James Corner. These readings have extended and developed my ideas and understanding of what I am doing, and I feel reassured and very pleased with the direction my project is taking.


My project is a careful, fine grain analysis of a series of places along Oakley Creek. My question is whether you can represent places through found objects, and in total contrast to the 'master plan' approach of the waterview-motorway-connection project. In Else/Where, Abrams and Hall talk about making the hidden visible through mapping, as a way to situate ourselves and add to a sense of community. Mapping a strategy for visualizing information that makes interpretation possible. Mapping is a 'creative enabling enterprise': a creative act that describes and constructs the space we live in, 'reveals and realises hidden potential.' My fine grain mapping through found objects will reveal ideas about those places not identifiable on a master-plan map.


The Agony of Mapping: Speculation, Critique and Invention, James Corner:
Corner goes on to talk about maps and reality, referencing Lewis Caroll: '...Carroll's tale in Sylvie and Bruno of a life-sized map... the map was useless, allowing Carroll's character Mein Herr to conclude 'so now we use the country itself, as its own map, and I assure you it does nearly as well.' A discussion about the blurred line between real and representation due to technology, reality as constituted or formed through our participation with things: material objects, images, cultural codes, places, cognitive schemata, events and maps. This reinforces my investigation into representing place through found objects, as one of the factors which form reality. This discussion also reflects the more detail a map has, the less useful it is. There is a certain amount of abstraction necessary.


The text then goes on to say there are two main parts to mapping: 1. digging, finding and exposing (which I will quite literally be doing in my data collecting!). 2. relating, connecting and structuring (processing, analysis and presentation of data in visual form). And refutes arguments that a map is secondary or representational, saying it is a process and creation, re-invention of the place in its own right. Some maps, like the master plan (or represented new motorway connection) treat the site like a blank area, simple geometric figures to be manipulated from high above. Instead of asserting authority and control, my approach will be more one of searching, disclosing and engendering new sets of possibility. 'Like a nomadic grazer, the exploratory map detours around the obvious so as to engage what remains hidden.   


Object-wise, I found it interesting to note Piaget's thoughts: '...to arrange objects mentally is not to merely imagine a series of images of them, or even to imagine the action of arranging them. It means arranging them just as positively and actively as i the action were physical.' My extraction, representation and display or arrangements of objects I find will actively involve viewers in this way. Also supporting my proposal, Corner concludes this section of the text by saying 'why not embrace the fact the potentially infintite capacity of mapping new conditions might enable more socially engaging modes of exchange,' and 'the notion that mapping should be restricted to empirical data sorting and array diminishes the profound social and orienting way of the cartographic enterprise.' My investigation will take me back to the roots of mapping, where it involved exploring.


The fact that I will be collecting data at only one point in time also seem important to note: recognition of mapping as an art form where temporal conditions are almost certain. Mapping needs to evolve with media to represent places more meaningfully today, will my mapping step to do this by recognition of static moments in places along Oakley Creek?


Sunday, 4 September 2011

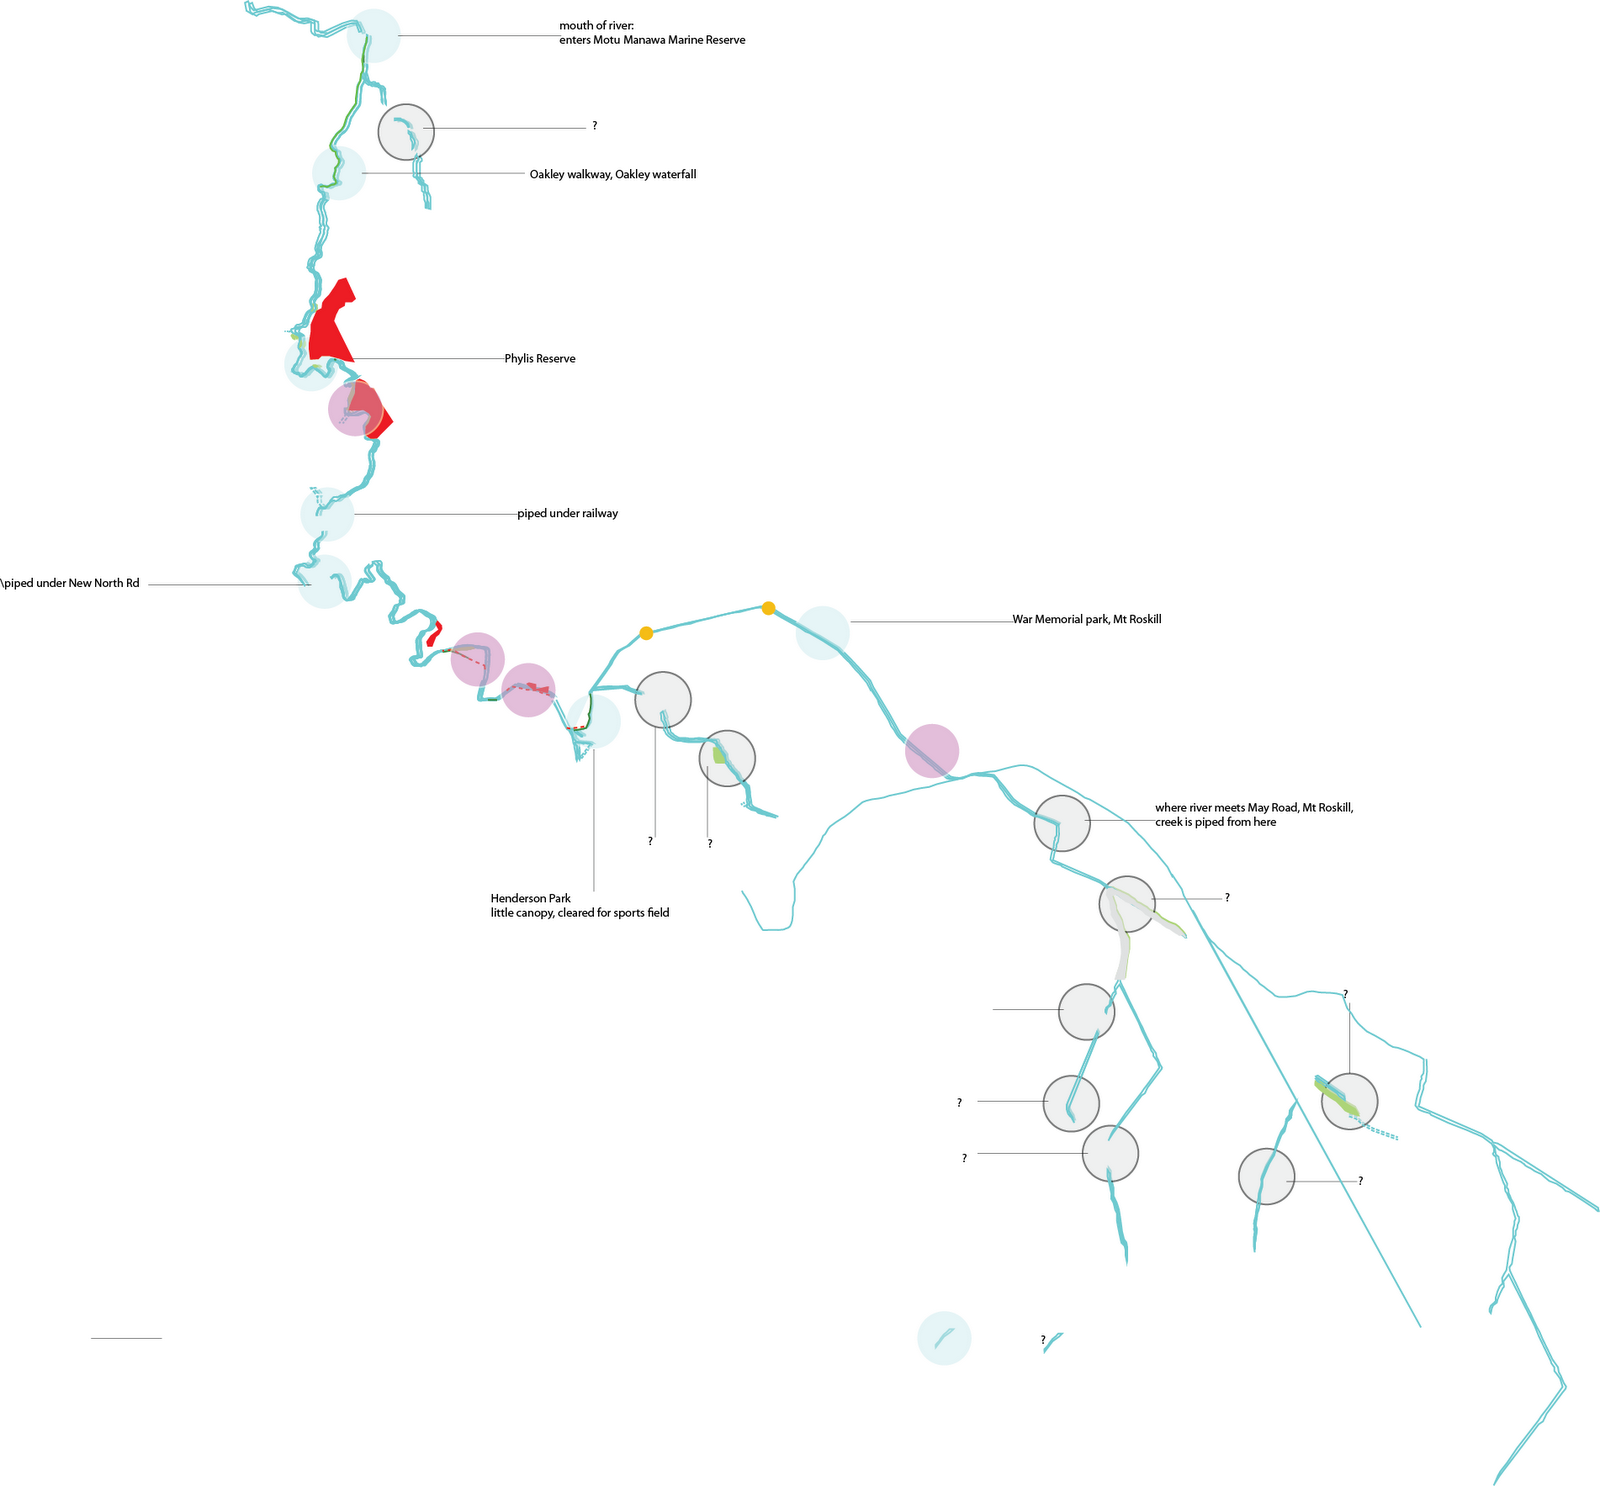
adjusted locations (because of evidence noted below)

I've adjusted locations due to evidence found so that I will document a variety, rich selection of'places' Oakley Creek travels through. I'm struggling with where the creek begins and ends, this is something I will discuss with Wendy. I need to clarify whether I am strictly documenting 'Oakley Creek,' or the whole story of the running water body.


The grey/black out-lines are previous areas I may not map anymore, the pink new, the light blue is no change.


information mapped from evidence documents

After trawling through many pdf documents for the big court event concerning Oakley Creek, I have discovered some useful information which may help me further define and back up locations I choose to focus on. This includes significant and valued vegetation, realignments of the creek, significant tree locations, copper skink locations, and locations of landfills...


I'm making a date with Wendy, who is head of the Friends of Oakley Creek foundation to discuss my mapping and areas I might look at closely, as well as how to gather data (should I take photos of what I find and seek expertise afterwards to identify flora, insects, etc?).


Saturday, 13 August 2011

insect, plant and animal life and Oakley Creek

Auckland Regional Council has a very useful document downloadable as a pdf from their website called 'Stream Classification and Instream Objectives for Auckland’s Urban Streams.' From it I have been able to find specific information on Oakley Creek.


For example, I have learnt that the only fish-life recorded at Oakley creek are the long and short-finned eels (although the long finned are short). There is also a list of very specific plant, mollusc and insect life found, and how many that will need further investigation. If I become familiar with what I might expect along Oakley Creek I will have a better chance at finding and  identifying them. 


From this research I have also gained knowledge of different canopy types, and riparian zone types. Whether plant-life is native or exotic will be important to identify. 


clarifying mapping focus and direction for visual communication

What I have decided:
-I am going to communicate the change of place through recording found unnatural objects (signs of human activity), plant and animal life, in set locations along Oakley Creek.


-These locations are still yet to be decided (I anticipate changes will be needed once I have visited these sites), but are suggested by map 2 in 'Mapping Oakley Creek,' a previous post. These 18 suggestions are marked according to where I anticipate a change of place (due to change of activity, type of location). 


Problems still to solve:
-How will I define the parameters of each 'location'? will it be defined by 10 of my steps along the stream from a certain point? 5? 20? 


-How will I map what I find at each location visually? Cross-section? Will this mean collecting measurements of depth, width, etc? Will I record where I find the objects?


-Plant life will be difficult for me to identify, and animal life difficult to find... how do I work around this?


-What type of media do I want to use for final presentation? Is it more suited to analogue or digital methods? Or a different kind of media?


mapping Oakley Creek

Mapping Oakley Creek turned out to be quite difficult! The Linz website didn't have accurate data, so I had to use a combination of the data I could find and google maps... (see map 1 below). I identified 8 zones which are points of change in the creek's 'story',  something I think is manageable. However...


Then I came across the Morphum website, a consultant employed by Metrowater to report on and map Oakley creek more accurately (they found a total of 37 assets were recorded as having incorrect data in the Metrowater GIS records and a further 91 not recorded in the GIS system). I altered my map accordingly (map 2), and discovered more areas of interest, places where the creek runs a different direction for some time, or appears and disappears under the land. I may have to re-examine my points of interest (they currently are at 18), a number I think is too large if I intend to go back at different times. Morphum also mapped 17 restoration opportunities (shown as green areas), and overland flow (dashed lines).


Oakley Creek: my 'site'?

Today I decided to find out more about the creek I used to run along (before I moved flats). I only knew that it as a creek that stretched along the side of the Mt Roskill War Memorial park, and now I know it is Oakley Creek, where it comes from and where it goes.  


Oakley Creek has been amid recent debate, due to the proposed Waterview connection. It has an organization called  'Friends of Oakley Creek' which envisions 'Oakley Creek - Te Auaunga and its environs restored and protected as a natural ecosystem incorporating a range of wildlife habitats, indigenous species and recreational amenities for present and future generations' (http://www.oakleycreek.org.nz/aboutus.htm).


It is considered the 'most natural' water-way left in urban Auckland, and has Auckland's only urban waterfall (just near Unitec). This creek definitely seems like it has a story to tell, and I would like to tell it.